KML Styling
Introduction
Keyhole Markup Langauge (KML), when created and output by GeoServer, is styled using Styled Layer Descriptors (SLD). This is the same approach used to style standard WMS output formats, but is a bit different from how Google Earth is normally styled, behaving more like Cascading Style Sheets (CSS). The style of the map is specified in the SLD file as a series of rules, and then the data matching those rules is styled appropriately in the KML output. For those unfamiliar with SLD, a good place to start is the Introduction to SLD. The remainder of this guide contains information about how to construct SLD documents in order to impact the look of KML produced by GeoServer.
Contents
SLD Generation from CSS
The CSS extension provides the facility to generate SLD files using a lightweight “Cascading Style Sheet” syntax. The CSS GUI provides a live map preview as you are editing your style in addition to an attribute reference for the current layer.
The generated styles will work seamlessly with KML output from GeoServer.
Creating SLD by hand
One can edit the SLD files directly instead of using the CSS extension. For the most complete exploration of editing SLDs see the Styling section. The examples below show how some of the basic styles show up in Google Earth.
SLD Structure
The following is a skeleton of a SLD document. It can be used as a base on which to expand upon to create more interesting and complicated styles.
<StyledLayerDescriptor version="1.0.0"
   xsi:schemaLocation="http://www.opengis.net/sld StyledLayerDescriptor.xsd"
   xmlns="http://www.opengis.net/sld"
   xmlns:ogc="http://www.opengis.net/ogc"
   xmlns:xlink="http://www.w3.org/1999/xlink"
   xmlns:xsi="http://www.w3.org/2001/XMLSchema-instance">
   <NamedLayer>
      <Name>Default Line</Name>
      <UserStyle>
         <Title>My Style</Title>
         <Abstract>A style</Abstract>
         <FeatureTypeStyle>
            <Rule>

                  <!-- symbolizers go here -->

            </Rule>
         </FeatureTypeStyle>
      </UserStyle>
   </NamedLayer>
</StyledLayerDescriptor>
Figure 3: Basic SLD structure
In order to test the code snippets in this document, create an SLD with the content as shown in Figure 3, and then add the specific code you wish to test in the space that says <!-- symbolizers go here -->. To view, edit, or add SLD files to GeoServer, navigate to Config -> Data -> Styles.
Points
In SLD, styles for points are specified via a PointSymbolizer. An empty PointSymbolizer element will result in a default KML style:
<PointSymbolizer>
</PointSymbolizer>
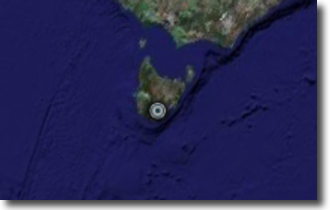
Figure 4: Default point
Three aspects of points that can be specified are color, opacity, and the icon.
Point Color
The color of a point is specified with a CssParameter element and a fill attribute. The color is specified as a six digit hexadecimal code.
<PointSymbolizer>
   <Graphic>
      <Mark>
         <Fill>
            <CssParameter name="fill">#ff0000</CssParameter>
         </Fill>
      </Mark>
   </Graphic>
</PointSymbolizer>
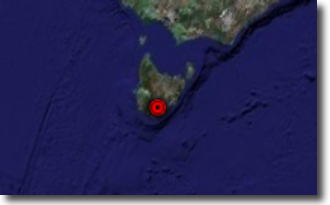
Figure 5: Setting the point color (#ff0000 = 100% red)
Point Opacity
The opacity of a point is specified with a CssParameter element and a fill-opacity attribute. The opacity is specified as a floating point number between 0 and 1, with 0 being completely transparent, and 1 being completely opaque.
<PointSymbolizer>
   <Graphic>
      <Mark>
         <Fill>
            <CssParameter name="fill-opacity">0.5</CssParameter>
         </Fill>
      </Mark>
   </Graphic>
</PointSymbolizer>
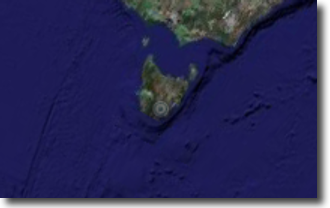
Figure 6: Setting the point opacity (0.5 = 50% opaque)
Point Icon
An icon different from the default can be specified with the ExternalGraphic element:
<PointSymbolizer>
   <Graphic>
      <ExternalGraphic>
         <OnlineResource xlink:type="simple"
            xlink:href="http://maps.google.com/mapfiles/kml/pal3/icon55.png"/>
         <Format>image/png</Format>
      </ExternalGraphic>
   </Graphic>
</PointSymbolizer>
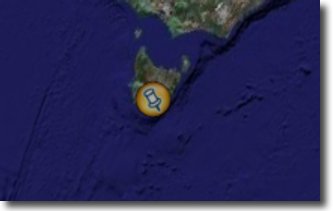
Figure 7: A custom icon for points
In Figure 7, the custom icon is specified as a remote URL. It is also possible to place the graphic in the GeoServer styles directory, and then specify the filename only:
<PointSymbolizer>
   <Graphic>
      <ExternalGraphic>
         <OnlineResource xlink:type="simple" xlink:href="icon55.png"/>
         <Format>image/png</Format>
      </ExternalGraphic>
   </Graphic>
</PointSymbolizer>
Figure 8: Specifying a local file for a graphic point
Note
When the layer is requested as KMZ, GeoServer packages any referenced icon images alongside the KML. The icons are copied into an images/ folder inside the .kmz archive so they remain available when the file is viewed offline.
Lines
Styles for lines are specified via a LineSymbolizer. An empty LineSymbolizer element will result in a default KML style:
<LineSymbolizer>
</LineSymbolizer>
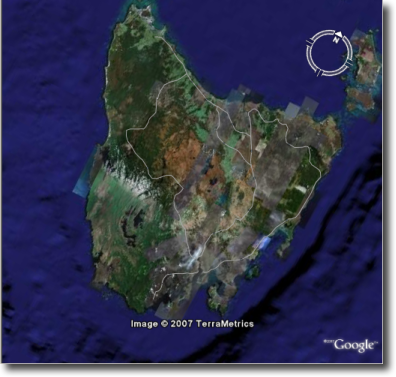
Figure 9: Default line
The aspects of the resulting line which can be specified via a LineSymbolizer are color, width, and opacity.
Line Color
The color of a line is specified with a CssParameter element and a stroke attribute. The color is specified as a six digit hexadecimal code.
<LineSymbolizer>
   <Stroke>
      <CssParameter name="stroke">#ff0000</CssParameter>
   </Stroke>
</LineSymbolizer>
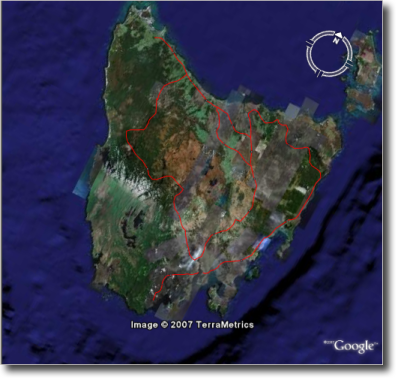
Figure 10: Line rendered with color #ff0000 (100% red)
Line Width
The width of a line is specified with a CssParameter element and a stroke-width attribute. The width is specified as an integer (in pixels):
<LineSymbolizer>
   <Stroke>
      <CssParameter name="stroke-width">5</CssParameter>
   </Stroke>
</LineSymbolizer>
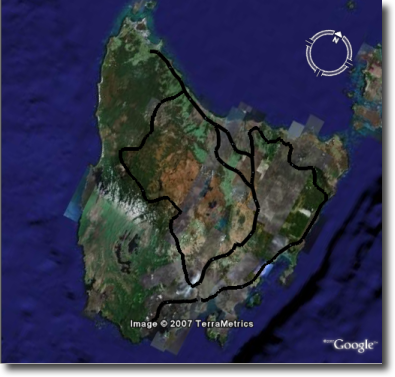
Figure 11: Line rendered with a width of five (5) pixels
Line Opacity
The opacity of a line is specified with a CssParameter element and a fill-opacity attribute. The opacity is specified as a floating point number between 0 and 1, with 0 being completely transparent, and 1 being completely opaque.
<LineSymbolizer>
   <Stroke>
      <CssParameter name="stroke-opacity">0.5</CssParameter>
   </Stroke>
</LineSymbolizer>
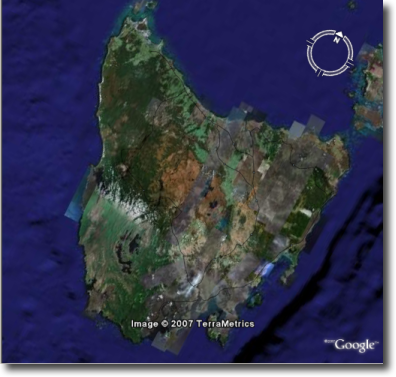
Figure 12: A line rendered with 50% opacity
Polygons
Styles for polygons are specified via a PolygonSymbolizer. An empty PolygonSymbolizer element will result in a default KML style:
<PolygonSymbolizer>
</PolygonSymbolizer>
Polygons have more options for styling than points and lines, as polygons have both an inside (“fill”) and an outline (“stroke”). The aspects of polygons that can be specified via a PolygonSymbolizer are stroke color, stroke width, stroke opacity, fill color, and fill opacity.
Polygon Stroke Color
The outline color of a polygon is specified with a CssParameter element and stroke attribute inside of a Stroke element. The color is specified as a 6 digit hexadecimal code:
<PolygonSymbolizer>
   <Stroke>
      <CssParameter name="stroke">#0000FF</CssParameter>
   </Stroke>
</PolygonSymbolizer>
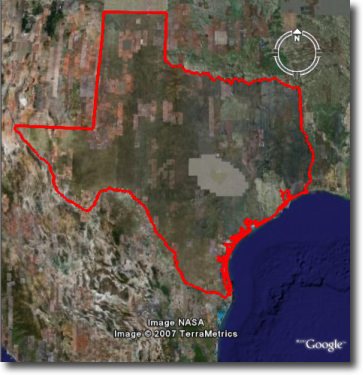
Figure 13: Outline of a polygon (#0000FF or 100% blue)
Polygon Stroke Width
The outline width of a polygon is specified with a CssParameter element and stroke-width attribute inside of a Stroke element. The width is specified as an integer.
<PolygonSymbolizer>
   <Stroke>
      <CssParameter name="stroke-width">5</CssParameter>
   </Stroke>
</PolygonSymbolizer>
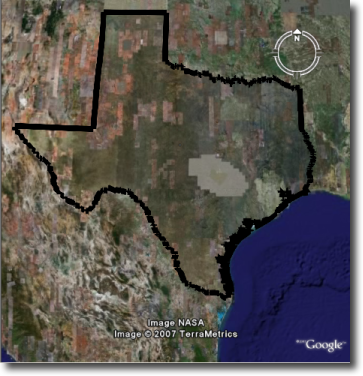
Figure 14: Polygon with stroke width of five (5) pixels
Polygon Stroke Opacity
The stroke opacity of a polygon is specified with a CssParameter element and stroke attribute inside of a Stroke element. The opacity is specified as a floating point number between 0 and 1, with 0 being completely transparent, and 1 being completely opaque.
<PolygonSymbolizer>
   <Stroke>
      <CssParameter name="stroke-opacity">0.5</CssParameter>
   </Stroke>
</PolygonSymbolizer>
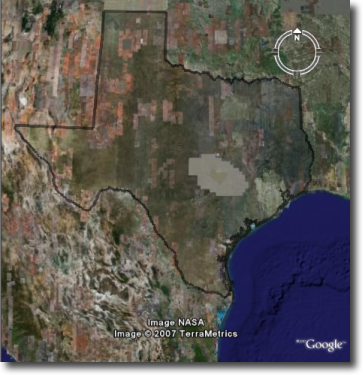
Figure 15: Polygon stroke opacity of 0.5 (50% opaque)
Polygon Fill Color
The fill color of a polygon is specified with a CssParameter element and fill attribute inside of a Fill element. The color is specified as a six digit hexadecimal code:
<PolygonSymbolizer>
   <Fill>
      <CssParameter name="fill">#0000FF</CssParameter>
   </Fill>
</PolygonSymbolizer>
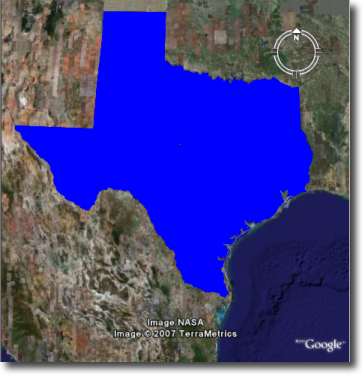
Figure 16: Polygon fill color of #0000FF (100% blue)
Polygon Fill Opacity
The fill opacity of a polygon is specified with a CssParameter element and fill-opacity attribute inside of a Fill element. The opacity is specified as a floating point number between 0 and 1, with 0 being completely transparent, and 1 being completely opaque.
<PolygonSymbolizer>
   <Fill>
      <CssParameter name="fill-opacity">0.5</CssParameter>
   </Fill>
</PolygonSymbolizer>
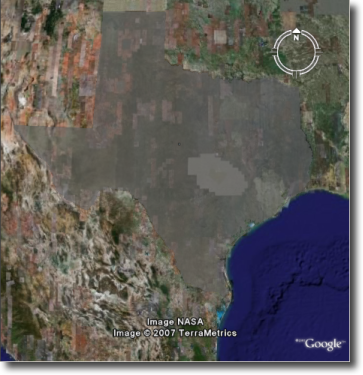
Figure 17: Polygon fill opacity of 0.5 (50% opaque)
Text Labels
There are two ways to specify a label for a feature in Google Earth. The first is with Freemarker templates (LINK?), and the second is with a TextSymbolizer. Templates take precedence over symbolizers.
Freemarker Templates
Specifying labels via a Freemarker template involves creating a special text file called title.ftl and placing it into the workspaces/<ws name>/<datastore name>/<feature type name> directory (inside the GeoServer data directory) for the dataset to be labeled. For example, to create a template to label the states dataset by state name one would create the file here: <data_dir>/workspaces/topp/states_shapefile/states/title.ftl. The content of the file would be:
${STATE_NAME.value}

Figure 18: Using a Freemarker template to display the value of STATE_NAME
For more information on Placemark Templates, please see our full tutorial (LINK FORTHCOMING).
TextSymbolizer
In SLD labels are specified with the Label element of a TextSymbolizer. (Note the ogc: prefix on the PropertyName element.)
<TextSymbolizer>
   <Label>
      <ogc:PropertyName>STATE_NAME</ogc:PropertyName>
   </Label>
</TextSymbolizer>
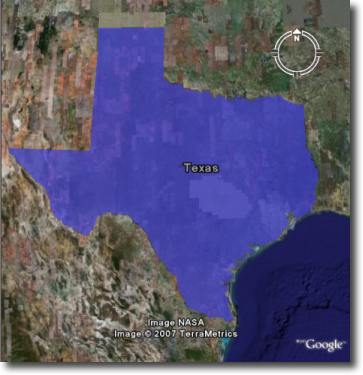
Figure 19: Using a TextSymbolizer to display the value of STATE_NAME
The aspects of the resulting label which can be specified via a TextSymbolizer are color and opacity.
TextSymbolizer Color
The color of a label is specified with a CssParameter element and fill attribute inside of a Fill element. The color is specified as a six digit hexadecimal code:
<TextSymbolizer>
   <Label>
      <ogc:PropertyName>STATE_NAME</ogc:PropertyName>
   </Label>
   <Fill>
      <CssParameter name="fill">#000000</CssParameter>
   </Fill>
</TextSymbolizer>
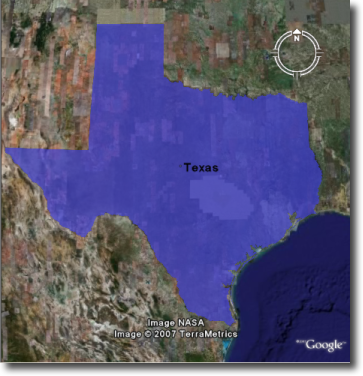
Figure 20: TextSymbolizer with black text color (#000000)
TextSymbolizer Opacity
The opacity of a label is specified with a CssParameter element and fill-opacity attribute inside of a Fill element. The opacity is specified as a floating point number between 0 and 1, with 0 being completely transparent, and 1 being completely opaque.
<TextSymbolizer>
   <Label>
      <ogc:PropertyName>STATE_NAME</ogc:PropertyName>
   </Label>
   <Fill>
      <CssParameter name="fill-opacity">0.5</CssParameter>
   </Fill>
</TextSymbolizer>
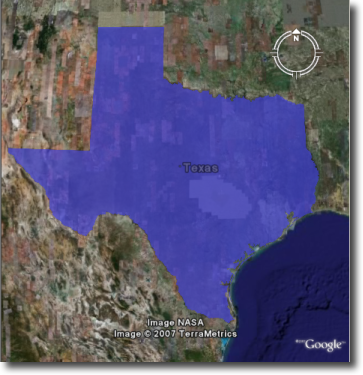
Figure 21: TextSymbolizer with opacity 0.5 (50% opaque)
Descriptions
When working with KML, each feature is linked to a description, accessible when the feature is clicked on. By default, GeoServer creates a list of all the attributes and values for the particular feature.
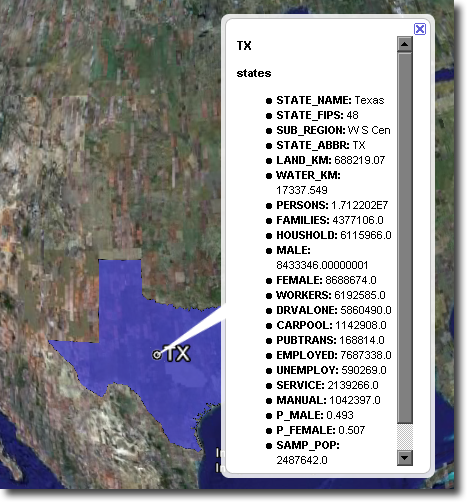
Figure 22: Default description for a feature
It is possible to modify this default behavior. Much like with featureType titles, which are edited by creating a title.ftl template, a custom description can be used by creating template called description.ftl and placing it into the feature type directory (inside the GeoServer data directory) for the dataset. For instance, to create a template to provide a description for the states dataset, one would create the file: <data_dir>/workspaces/topp/states_shapefile/states/description.ftl. As an example, if the content of the description template is:
This is the state of ${STATE_NAME.value}.
The resultant description will look like this:
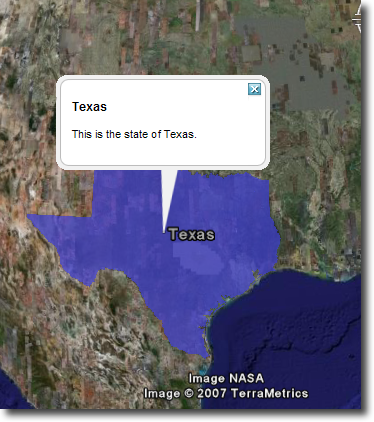
Figure 23: A custom description
It is also possible to create one description template for all featureTypes in a given namespace. To do this, create a description.ftl file as above, and save it as <data_dir>/templates/<workspace>/description.ftl. Please note that if a description template is created for a specific featureType that also has an associated namespace description template, the featureType template (i.e. the most specific template) will take priority.
One can also create more complex descriptions using a combination of HTML and the attributes of the data. A full tutorial on how to use templates to create descriptions is available in our page on KML Placemark Templates. (LINK?)
SLD Generation from CSS SLD Structure Points Lines Polygons Text Labels Descriptions