Z ordering single layer example
The OpenStreetMap dataset uses extensively a z_order attribute to model the above/below relationships
between elements in the real world.
A small downloadable shapefile is provided that shows a small area with a rich set of different z-orders,
where roads and rails go above and below each other.
For reference, this is the dataset schema:
Name |
Type |
Notes |
|---|---|---|
osm_id |
numeric |
|
type |
string |
The type of the segment, can be “mainroads”, “minorroads”, “railways”, … |
bridge |
numeric |
0 or 1 |
ref |
numeric |
0 or 1 |
tunnel |
numeric |
|
oneway |
numeric |
0 or 1 |
z_order |
numeric |
|
class |
string |
The dataset contains several different values for z_order, in particular: -10, -7, -5, -3, -1, 0, 3, 4, 5, 7, 9, 10, 13, 14, 15, 17, 19.
Here is a sample CSS style using z-ordering, but not groups, to perform the display.
Road casing is achieved by multiple FeatureTypeStyle, or z-index values in CSS:
[class = 'railways' and bridge = 1] {
  stroke: #333333;
  stroke-width: 8;
  z-index: 0;
}

[class = 'minorroads'] {
  stroke: #a69269;
  stroke-width: 3;
  z-index: 0;
}

[class = 'mainroads'] {
  stroke: #ff0000;
  stroke-width: 5;
  z-index: 0;
}

[class = 'motorways'] {
  stroke: #990000;
  stroke-width: 8;
  z-index: 0;
}

[class = 'railways' and bridge = 1] {
  stroke: #ffffff;
  stroke-width: 6;
  z-index: 1;
}

[class = 'railways'] {
  stroke: #333333;
  stroke-width: 3;
  z-index: 2;
}

[class = 'railways'] {
  stroke: #ffffff;
  stroke-width: 1.5;
  stroke-dasharray: 5, 5;
  z-index: 3;
}

[class = 'motorways'] {
  stroke: #ff6666;
  stroke-width: 6;
  stroke-linecap: round;
  z-index: 3;
}

[class = 'minorroads'] {
  stroke: #ffffff;
  stroke-width: 2,5;
  stroke-linecap: round;
  z-index: 3;
}

[class = 'mainroads'] {
  stroke: #ff9999;
  stroke-width: 4;
  stroke-linecap: round;
  z-index: 3;
}

* {
 sort-by: "z_order";
}
The sorting is achieved by using the sort-by property, which translates into a sortBy VendorOption
in SLD. A full equivalent SLD is available for download.
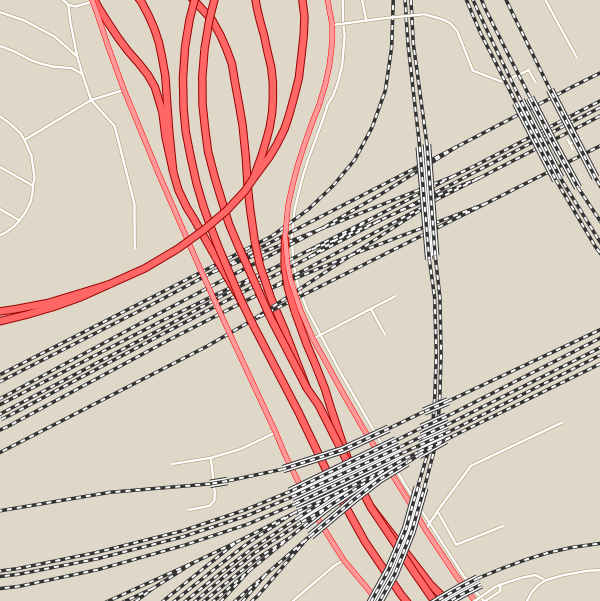
This is the resulting map:
As one can see, there are evident issues:
Roads and rails are not showing any evident z-ordering, in fact, all rails are below roads, but their dashed white center shows a mix of below and above roads
The rails bridges (depicted with a third thicker line around the rail symbol) are consistently below some other road or rail, while they should be above.
This is mostly happening because the various FeatureTypeStyle elements are not put doctor in a single group.
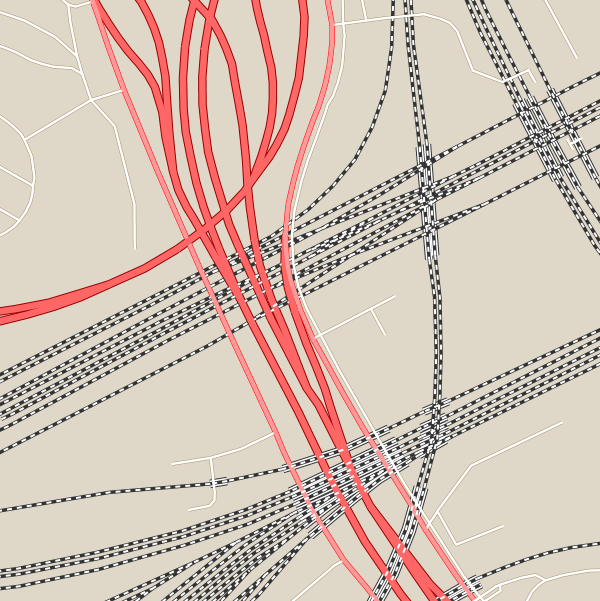
A slight change in the CSS, grouping all levels in the same sortByGroup, solves the issues above:
[class = 'railways' and bridge = 1] {
  stroke: #333333;
  stroke-width: 8;
  z-index: 0;
}

[class = 'minorroads'] {
  stroke: #a69269;
  stroke-width: 3;
  z-index: 0;
}

[class = 'mainroads'] {
  stroke: #ff0000;
  stroke-width: 5;
  z-index: 0;
}

[class = 'motorways'] {
  stroke: #990000;
  stroke-width: 8;
  z-index: 0;
}

[class = 'railways' and bridge = 1] {
  stroke: #ffffff;
  stroke-width: 6;
  z-index: 1;
}

[class = 'railways'] {
  stroke: #333333;
  stroke-width: 3;
  z-index: 2;
}

[class = 'railways'] {
  stroke: #ffffff;
  stroke-width: 1.5;
  stroke-dasharray: 5, 5;
  z-index: 3;
}

[class = 'motorways'] {
  stroke: #ff6666;
  stroke-width: 6;
  stroke-linecap: round;
  z-index: 3;
}

[class = 'minorroads'] {
  stroke: #ffffff;
  stroke-width: 2,5;
  stroke-linecap: round;
  z-index: 3;
}

[class = 'mainroads'] {
  stroke: #ff9999;
  stroke-width: 4;
  stroke-linecap: round;
  z-index: 3;
}

* {
 sort-by: "z_order";
 sort-by-group: "roadsGroup";
}
A full equivalent SLD is also available for download.
The result now shows proper z-ordering: