Vector tiles tutorial
This tutorial will show how to use the GeoServer vector tiles output.
Why use vector tiles?
The advantages of vector tiles are:
Rendering is done by the client (for example, OpenLayers), not by the server. This allows different maps/applications to style a map differently without having to reconfigure GeoServer.
The size of a vector tile is usually smaller than an image tile, resulting in faster data transfer and lower bandwidth usage.
GeoWebCache, embedded with GeoServer efficiently stores the vector tile data. Since styling is done by the client, not the server, GeoWebCache only needs to store one tile for all different styles.
Because the vector data is available on the client, very high-resolution maps can be drawn without corresponding increases in bandwidth.
The client has native access to the actual feature information (attributes and geometry), allowing for very sophisticated rendering.
On the other hand, the main disadvantage of vector tiles is that the geographic data may need to be pre-processed to allow the client to do the drawings it requires (similar to preprocessing data for image maps). With this in mind, vector tiles should only be used for rendering.
Vector tile formats
GeoServer can also produce vector tiles in three formats: GeoJSON, TopoJSON, and MapBox Vector (MVT). These are also supported by OpenLayers and other clients.
MVT is the preferred format for production.
Format |
MIME |
Description |
|---|---|---|
|
Recommended Format This is an efficient binary format that is widely supported by almost all Vector Tile applications. |
|
|
This is a human readable JSON format. Although many geo-spatial applications support GeoJSON datasets, few Vector Tile applications support tiles in this format. Supported by Open Layers 3. |
|
|
This is a very complex, but somewhat human readable JSON format that is good for polygon coverages. It is not a widely supported and very few Vector Tile applications support it. Supported by Open Layers 3. |
Publish vector tiles in GeoWebCache
We’ll be publishing our vector tiles through GeoWebCache and publishing the layer in a custom OpenLayers application.
For this tutorial, we’ll be using the layer opengeo:countries to show off the capabilities, though with slight modifications, any layer will do.
Note
Download the Admin 0 - Countries shapefile and publish the layer as opengeo:countries.
In the GeoServer admin interface, click
Tile LayersunderTile Caching.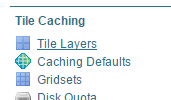
Tile Layers
Click
opengeo:countriesin the list of layers.By default the tile formats are
image/jpegandimage/png. Check the boxes for the following vector tile formats:application/json;type=geojsonapplication/json;type=topojsonapplication/vnd.mapbox-vector-tile
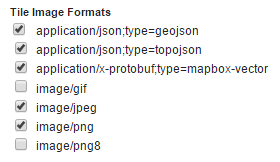
Vector tiles tile formats
Click
Save.
Our layer is now ready to be served.
Vector Tiles Metatiling Support in Tile Layers
GeoServer supports metatiling for Vector Tiles, extending a well-known raster tiles optimization technique to vector tiles as well. This feature can significantly improve performance and database efficiency.
Overview
Metatiling groups multiple vector tiles into a single metatile that is generated in one operation and then split into individual tiles on disk.
For example, with a 4x4 metatile:
One request produces 16 vector tiles
Data is queried once instead of 16 times
Geometry processing and encoding are shared
This approach is particularly beneficial for complex vector datasets or slow data sources (e.g. expensive database views), especially when seeding tiles. Advantages of Vector Tile Metatiling ^^^^^^^^^^^^^^^^^^^^^^^^^^^^^^^^^^^^ Reduced Database Load ~~~~~~~~~~~~~~~~~~~~~ Without metatiling, GeoServer typically performs
one database query per vector tile
repeated spatial filtering and geometry decoding
With metatiling enabled:
a single database query retrieves all features for the entire metatile extent
the same result set is reused to generate multiple tiles
Example:
2x2 metatile → 1 query instead of 4
4x4 metatile → 1 query instead of 16
8x8 metatile → 1 query instead of 64
Lower Latency and Better Throughput
Expensive operations such as database access, geometry clipping and simplification are performed once per metatile. Overall request latency is reduced and server throughput increases under load.
Notes on memory Constraints and Safety Limits
Note that vector metatiling increases the amount of data processed at once, which has direct implications for memory usage.
Although the final vector tile files (.pbf) are typically small, the in-memory data structures used during generation are much larger:
some buffering is applied before the geometries are clipped
intermediate command buffers are built for vector tiles encoding (note that there is 1 tileEncoder for each subtile of a metatile)
To ensure stability, vector tile metatiling in GeoServer is governed by the same memory constraints used for WMS rendering:
the WMS maximum rendering memory setting acts as a hard limit
metatile generation is monitored for memory growth
processing is aborted if the estimated memory usage for the metatile exceeds the configured threshold
This guarantees that vector tile metatiling cannot exhaust heap memory or destabilize the server. When configuring vector tile metatiling:
larger metatile sizes increase efficiency but also memory usage
complex polygon layers require more memory than point or line layers
administrators may need to adjust the WMS rendering memory limit to accommodate metatiling
Create OpenLayers application - TMS Vector Tiles
Create a
www/tms-vectortilesdirectory inside your GeoServer Data Directory.Download the latest version of OpenLayers. Download the v<ol-version>-package.zip file`_.
Extract the following files from the downloaded archive to the directory created in step 1:
v<ol-version>-package/dist/ol.jsv<ol-version>-package/ol.css
In a text editor, create a new file with the following content:
<!DOCTYPE html -->
<html>
<head>
  <title>Vector tiles</title>
  <script src="ol.js"></script>
  <link rel="stylesheet" href="ol.css">
  <style>
    html, body {
      font-family: sans-serif;
      width: 100%;
    }
    .map {
      height: 500px;
      width: 100%;
    }
  </style>
</head>
<body>
  <h3>Mapbox Protobuf - vector tiles TMS</h3>
  <div id="map" class="map"></div>
  <script>

  var style_simple = new ol.style.Style({
    fill: new ol.style.Fill({
      color: '#ADD8E6'
    }),
    stroke: new ol.style.Stroke({
      color: '#880000',
      width: 1
    })
  });

  function simpleStyle(feature) {
    return style_simple;
  }

  var layer = 'opengeo:countries';
  var projection_epsg_no = '900913';
  var map = new ol.Map({
    target: 'map',
    view: new ol.View({
      center: [0, 0],
      zoom: 2
    }),
    layers: [new ol.layer.VectorTile({
      style:simpleStyle,
      source: new ol.source.VectorTile({
        tilePixelRatio: 1, // oversampling when > 1
        tileGrid: ol.tilegrid.createXYZ({maxZoom: 19}),
        format: new ol.format.MVT(),
        url: '/geoserver/gwc/service/tms/1.0.0/' + layer +
            '@EPSG%3A'+projection_epsg_no+'@pbf/{z}/{x}/{-y}.pbf'
      })
    })]
  });
  </script>
</body>
</html>
Save this file in the directory created above as
index.html.Navigate to
http://localhost:8080/geoserver/www/tms-vectortiles/index.htmland verify that the output shows without any errors.Note
If your GeoServer is deployed at a server other than
http://localhost:8080/geoserver/, then please adjust the above URL.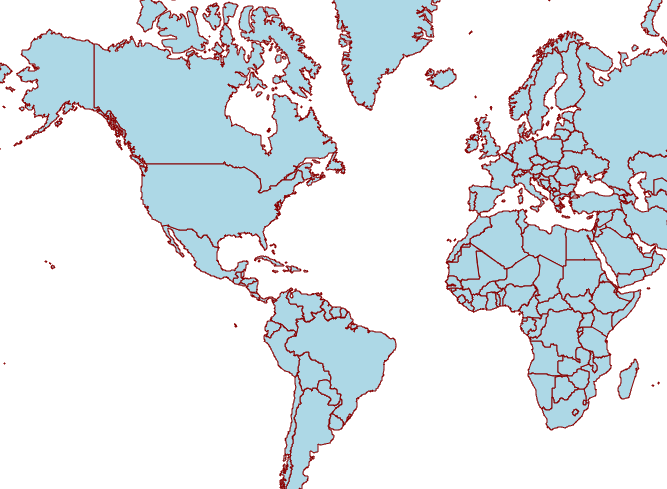
Vector tile output
These tiles are being rendered by the OpenLayers client.
Create OpenLayers application - WMS Vector Tiles
Note
Vector tiles requested with WMS allows retrieving non-cached vector tiles (server side) by setting the tiled=false parameter on the getMap request. This setting could be particularly useful when serving fast changing source data that should constantly be kept up-to-date for display.
However, in terms of rendering performances, vector tiles can be faster than a PNG provided there are few features per tile and a limited amount of attributes in the source vector data.
Vice versa, for tiles containing a large number of features with a long list of attributes the PNG may still be the preferred option since it is orders of magnitude smaller in size.
Create a
www/wms-vectortilesdirectory inside your GeoServer Data Directory.Download the latest version of OpenLayers. Download the v<ol-version>-package.zip file.
Extract the following files from the downloaded archive to the directory created in step 1:
v<ol-version>-package/dist/ol.jsv<ol-version>-package/ol.css
In a text editor, create a new file with the following content:
<!doctype html>
<html>
<head>
  <title>Vector tiles</title>
  <script src="ol.js"></script>
  <link rel="stylesheet" href="ol.css">
  <style>
    html, body {
      font-family: sans-serif;
      width: 100%;
    }
    .map {
      height: 500px;
      width: 100%;
    }
  </style>
</head>
<body>
  <h3>Mapbox Protobuf - vector tiles WMS</h3>
  <div class="refresh-container">
  <button id="refresh-button" type="button" onclick="updateFunc();">Refresh/reload cache</button>
  </div>
  <div id="map" class="map"></div>
  <script>

    var layerParams = {'LAYERS': 'opengeo:countries', 'TILED': false, 'FORMAT': 'application/vnd.mapbox-vector-tile'};

  var sourceOptions = {
      url: '/geoserver/wms?',
      params: layerParams,
      serverType: 'geoserver',
      transition: 0,
      hidpi: false
    };

  var WMSTileSource = new ol.source.TileWMS(sourceOptions);

  var mvtVectorSource = new ol.source.VectorTile(
    Object.assign(
      sourceOptions,
      {
        url: undefined,
        format: new ol.format.MVT({layerName: '_layer_'}),
        tileUrlFunction: function(tileCoord, pixelRatio, projection) {
          return WMSTileSource.tileUrlFunction(tileCoord, pixelRatio, projection);
        }
      }
    )
  );


    var updateFunc = function () {
    WMSTileSource.updateParams(
      Object.assign(
        layerParams,
        {
          '_v_' : Date.now()
        }
      )
    );
    WMSTileSource.tileCache.pruneExceptNewestZ();
    mvtVectorSource.clear();
    mvtVectorSource.refresh();
  };


  var layer = new ol.layer.VectorTile({
    source: mvtVectorSource
  });

  var map = new ol.Map({
    target: 'map',
    view: new ol.View({
      center: [0,0],
      zoom: 2
    }),
    layers: [layer]
  });

  </script>
</body>
</html>
Save this file in the directory created above as
index.html.Navigate to
http://localhost:8080/geoserver/www/wms-vectortiles/index.htmland verify that the output shows without any errors.Note
If your GeoServer is deployed at a server other than
http://localhost:8080/geoserver/, then please adjust the above URL.
Styling vector tiles
Since these tiles are rendered in the client, we need only change the styling instructions inside the client application. No changes to GeoServer are required, and tiles will not have to be regenerated.
Change the fill color to light green:
var style_simple = new ol.style.Style({
  fill: new ol.style.Fill({
    color: 'lightgreen'
  }),
   stroke: new ol.style.Stroke({
      color: '#880000',
      width: 1
    })
}) ;
Save the file and reload the application.
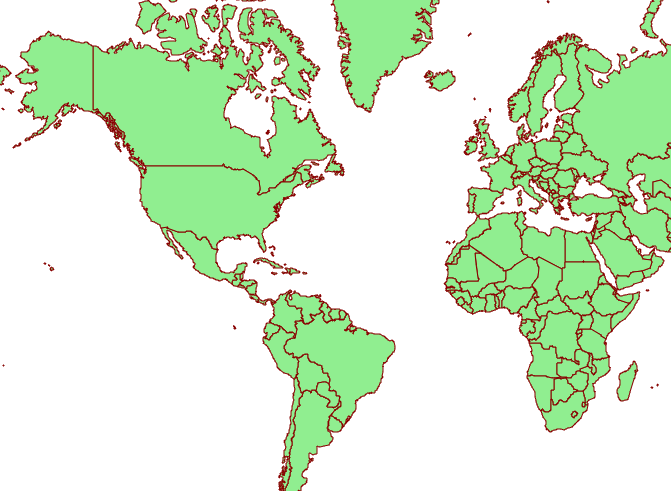
Vector tile output with alternate color
We can also do attributed-based styling. This dataset contains has a property (
region_un) which contains the region the country is in. Let’s highlight countries in Africa by adding another style definition below the existing style:var style_highlighted = new ol.style.Style({ fill: new ol.style.Fill({ color: 'yellow' }), stroke: new ol.style.Stroke({ color: '#880000', width: 1 }) });Replace the existing style function:
 function simpleStyle(feature) {
   return style_simple;
 }
with the following:
 function simpleStyle(feature) {
   if (feature.get("region_un") == "Africa") {
     return style_highlighted;
   }
   return style_simple;
 }
Save the file and reload the application.
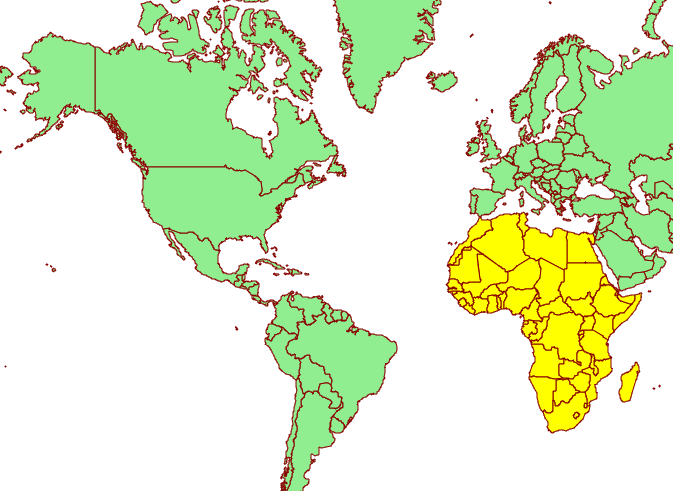
Vector tile output with Africa highlighted