Raster symbolizer
The raster symbolizer styles raster (coverage) layers. A raster is an array of information with each cell in the array containing one or more values, stored as “bands”.
The full syntax of a raster symbolizer is:
symbolizers:
- raster:
    opacity: <expression>
    channels:
      gray:
        <channel_options>
      red:
        <channel_options>
      green:
        <channel_options>
      blue:
        <channel_options>
    color-map:
      type: <ramp|interval|values>
      entries:
      - [color, entry_opacity, band_value, text_label]
    contrast-enhancement:
      mode: <normalize|histogram>
      gamma: <expression>
    x-inclusion: <text>
where:
Property |
Required? |
Description |
Default value |
|---|---|---|---|
|
No |
Opacity of the entire display. Valid values are a decimal between |
|
|
No |
Selects the band(s) to display and the display method. |
N/A |
|
No |
Display a single band as a grayscale image. Cannot be used with |
|
|
No |
Display three bands as an RGB image. Must be used with |
|
|
No |
Display three bands as an RGB image. Must be used with |
|
|
No |
Display three bands as an RGB image. Must be used with |
|
|
No |
Creates a mapping of colors to grid values. Can only be used with a single band. |
N/A |
|
No |
Type of color mapping. Options are |
|
|
No |
Values for the color mapping. Syntax is a list of tuples. |
N/A |
|
Yes |
Color for the particular color map entry. Value is a standard color value. |
N/A |
|
Yes |
Opacity of the particular color map entry. Valid values are a decimal between |
N/A |
|
Yes |
Grid value to use for the particular color map entry. Values are data-dependent. Behavior at or around this value is determined by the color ramp |
N/A |
|
No |
Label for the particular color map entry |
Blank |
|
No |
Modifies the contrast of the display |
N/A |
|
No |
Type of contrast enhancement. Options are |
|
|
No |
Multiplier value for contrast adjustment. A value greater than 1 will increase darkness, while a value less than 1 will decrease darkness. |
|
Additional “vendor options” properties for Color compositing and color blending:
Additional “vendor options” properties for Color compositing and color blending:
Property |
Required? |
Description |
Default value |
|---|---|---|---|
|
No |
Allows for both alpha compositing and color blending options between symbolizers. |
N/A |
|
No |
Allows the rendering engine to use the symbolizer mapping to define a “base” buffer for subsequent compositing and blending using |
|
Additional “vendor options” properties for Rendering Selection:
Additional “vendor options” properties for Rendering Selection:
Property |
Required? |
Description |
Default value |
|---|---|---|---|
|
No |
Define if rule should be included in style for |
|
Examples
Enhanced contrast
This example takes a given raster and lightens the output by a factor of 2:
symbolizers:
- raster:
    contrast-enhancement:
      gamma: 0.5
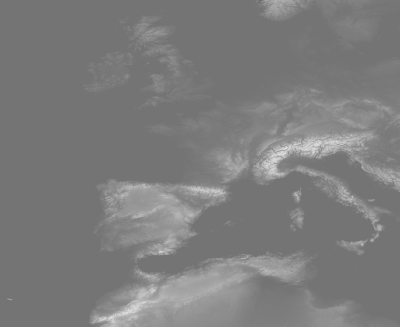
Lightened image
Normalized output
This example takes a given raster and adjusts the contrast so that the smallest values are darkest and the highest values are lightest:
symbolizers:
- raster:
    contrast-enhancement:
      mode: normalize
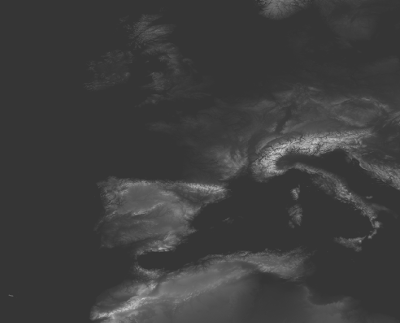
Normalized image
Band selection
This example takes a raster with multiple bands and outputs band 2 as a grayscale image (This could be used to select a single band in a multi-band image to use with color-map):
name: raster
feature-styles:
- name: name
  rules:
  - symbolizers:
    - raster:
        opacity: 1.0
        channels:
          gray: 2
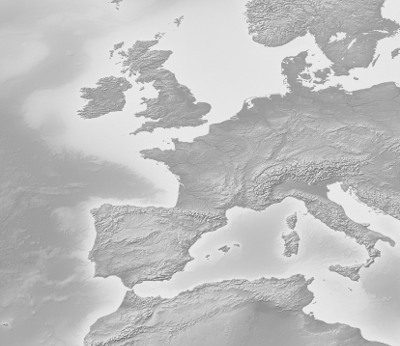
Grayscale band selection
Band selection with contrast
This example takes an RGB raster, doubles the intensity of the red, and normalizes the green band:
name: raster
feature-styles:
- name: name
  rules:
  - symbolizers:
    - raster:
        channels:
          red:
            name: 1
            contrast-enhancement:
              gamma: .5
          green:
            name: 2
            contrast-enhancement:
              mode: normalize
          blue:
            name: 3
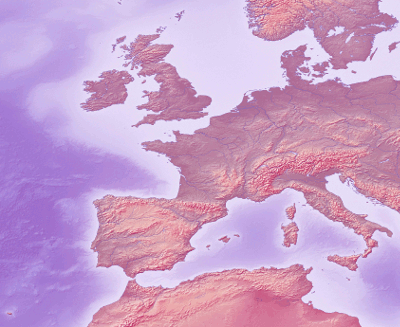
Band selection with contrast enhancement
Color ramp
This example shows a color ramp from red to green to blue, with raster band values from 0-200:
symbolizers:
- raster:
    color-map:
      type: ramp
      entries:
      - ['#FF0000', 1, 0, red]
      - ['#00FF00', 1, 100, green]
      - ['#0000FF', 1, 200, blue]
In this example, the grid values will have the following colors applied:
Less than or equal to 0 will have an output color of solid red
Between 0 and 100 will have an output color interpolated between red and green
Between 100 and 200 will have an output color interpolated between green and blue
Greater than 200 will have an output color of solid blue
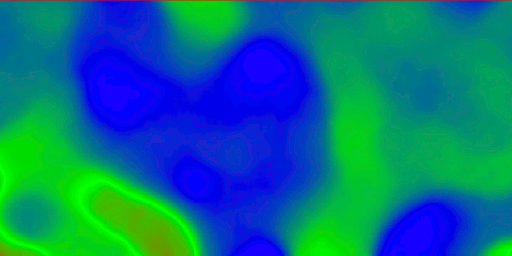
Color map with ramp
Color intervals
The same example as above, but with the color-map type set to intervals:
symbolizers:
- raster:
    color-map:
      type: intervals
      entries:
      - ['#FF0000', 1, 0, red]
      - ['#00FF00', 1, 100, green]
      - ['#0000FF', 1, 200, blue]
In this example, the grid values will have the following colors applied:
Less than or equal to 0 will have an output color of solid red
Between 0 and 100 will have an output color of solid green
Between 100 and 200 will have an output color of solid blue
Greater than 200 will not be colored at all (transparent)
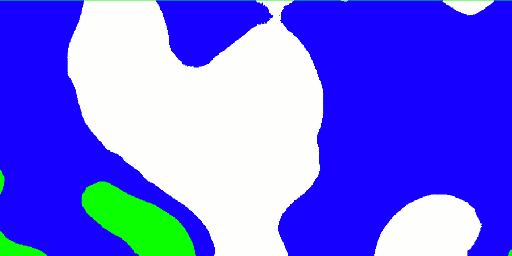
Color map with intervals
Color values
The same example as above, but with the color-map type set to values:
symbolizers:
- raster:
    color-map:
      type: values
      entries:
      - ['#FF0000', 1, 0, red]
      - ['#00FF00', 1, 100, green]
      - ['#0000FF', 1, 200, blue]
In this example, the grid values will have the following colors applied:
Equal to 0 will have an output color of solid red
Equal to 100 will have an output color of solid green
Equal to 200 will have an output color of solid blue
Any other values (even those in between the above values) will not be colored at all.
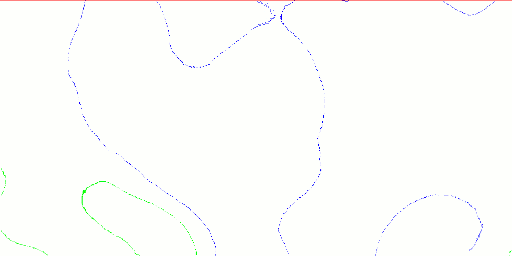
Color map with values