5.6. MBStyle Workbook Conclusion
We hope you have enjoyed this styling workshop.
Additional resources:
5.6.1. MBStyle Tips and Tricks
5.6.2. MBStyle Workshop Answer Key
The following questions were listed throughout the workshop as an opportunity to explore the material in greater depth. Please do your best to consider the questions in detail prior to checking here for the answer. Questions are provided to teach valuable skills, such as a chance to understand how feature type styles are used to control z-order, or where to locate information in the user manual.
Note
Coming Soon
5.6.2.1. Classification
Answer for Challenge Classification:
Challenge: Create a new style adjust road appearance based on type.
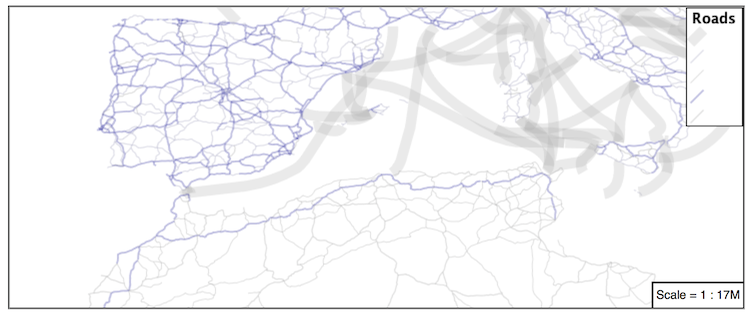
Hint: The available values are ‘Major Highway’,’Secondary Highway’,’Road’ and ‘Unknown’.
Here is an example:
 {
  "version": 8,
  "name": "line_example",
  "layers": [
    {
      "id": "line_hwy1",
      "source-layer": "ne:roads",
      "type": "line",
      "filter": ["==", "type", "Major Highway"],
      "paint": {
        "line-color": "#000088",
        "line-width": 1.25,
        "line-opacity": 0.25
      }
    },
    {
      "id": "line_hwy2",
      "source-layer": "ne:roads",
      "type": "line",
      "filter": ["==", "type", "Secondary Highway"],
      "paint": {
        "line-color": "#8888AA",
        "line-width": 0.75,
        "line-opacity": 0.25
      }
    },
    {
      "id": "line_road",
      "source-layer": "ne:roads",
      "type": "line",
      "filter": ["==", "type", "Road"],
      "paint": {
        "line-color": "#888888",
        "line-width": 0.75,
        "line-opacity": 0.25
      }
    },
    {
      "id": "line_unk",
      "source-layer": "ne:roads",
      "type": "line",
      "filter": ["==", "type", "Unknown"],
      "paint": {
        "line-color": "#888888",
        "line-width": 0.5,
        "line-opacity": 0.25
      }
    }
  ]
}
5.6.2.2. One Rule Classification
Answer for Challenge One Rule Classification:
Challenge: Create a new style and classify the roads based on their scale rank using expressions in a single rule instead of multiple rules with filters.
This exercise requires looking up information in the MBstyle user guide.
The Mapbox Style specification functions provides details.
5.6.2.3. Label Shields
Answer for Challenge Label Shields:
Challenge: Have a look at the documentation for putting a graphic on a text symbolizer in SLD and reproduce this technique in MBStyle.
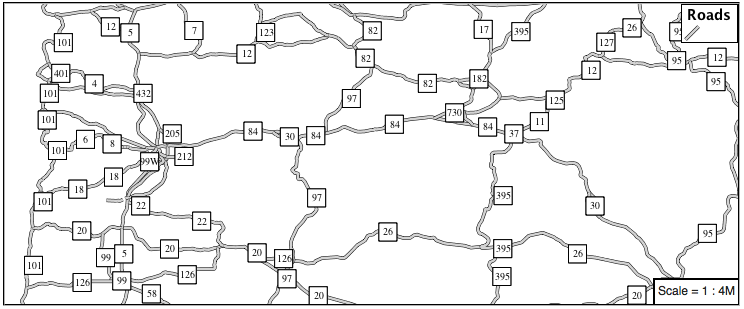
The use of a label shield is a vendor specific capability of the GeoServer rendering engine. The tricky part of this exercise is finding which symbol layout parameters give the desired behavior, mainly icon-text-fit but also the various placement and overlap parameters to allow the text to be drawn atop the labels ( see symbol layer).
{
  "version": 8,
  "name": "line_example",
  "sprite": "http://localhost:8080/geoserver/styles/sprites",
  "layers": [
    {
      "id": "line_casing",
      "source-layer": "ne:roads",
      "type": "line",
      "paint": {
        "line-color": "#000000",
        "line-width": 3,
      }
    },
    {
      "id": "line_inner",
      "source-layer": "ne:roads",
      "type": "line",
      "paint": {
        "line-color": "#D3D3D3",
        "line-width": 2,
      }
    },
    {
      "id": "label",
      "source-layer": "ne:roads",
      "type": "symbol",
      "layout": {
        "icon-image": "white_square16",
        "icon-text-fit": "width",
        "icon-text-fit-padding": [2, 2, 2, 2],
        "text-field": "{name}",
        "text-font": ["Ariel"],
        "text-font-size": 10,
        "text-ignore-placement": true,
        "text-allow-overlap": true,
        "icon-ignore-placement": true,
        "icon-allow-overlap": true,
        "symbol-placement": "line",
        "symbol-spacing": 0

      }
      "paint": {
        "text-color": "black"
      }
    }
  ]
}
5.6.2.4. Interval
Answer for Explore Interval:
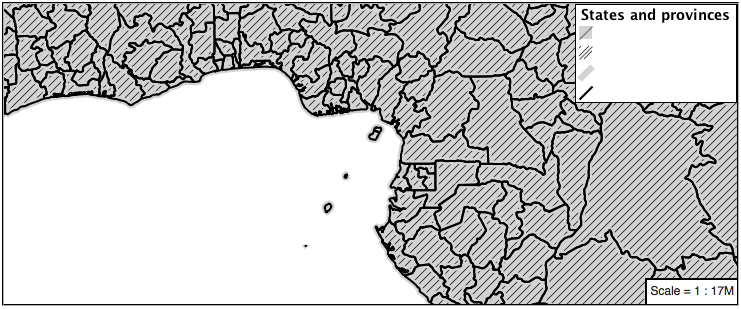
An exciting use of the GeoServer fill-pattern symbols is theming by changing the pattern used.
Explore: Use the interval function to theme by datarank.
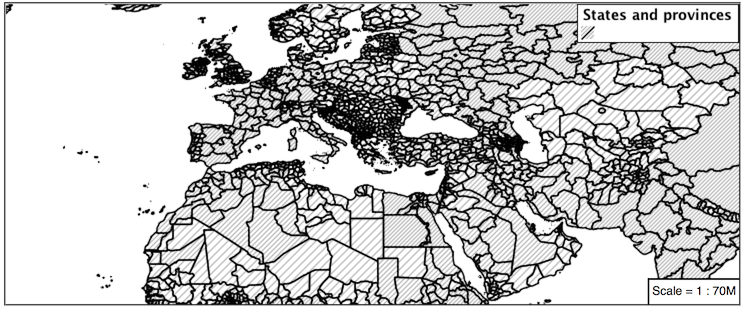
Example:
 {
  "version": 8,
  "name": "polygon_example",
  "sprite": "http://localhost:8080/geoserver/styles/sprites",
  "layers": [
    {
      "id": "polygon",
      "source-layer": "ne:states_provinces_shp",
      "type": "fill",
      "paint": {
        "fill-pattern": {
          "property": "datarank",
          "type": "interval",
          "stops": [
            [4, "grey_diag8"],
            [6, "grey_diag16"]
          ]
        }
      }
    }
  ]
}
5.6.2.5. Halo
Answer for Challenge Halo:
The halo example used the fill color and opacity for a muted halo, while this improved readability it did not bring attention to our labels.
A common design choice for emphasis is to outline the text in a contrasting color.
Challenge: Produce a map that uses a white halo around black text.
Here is an example:
{
  "version": 8,
  "name": "polygon_example",
  "layers": [
    {
      "id": "polygon_fill",
      "source-layer": "ne:states_provinces_shp",
      "type": "fill",
      "paint": {
        "fill-color": "#7EB5D3",
        "fill-outline-color": "gray"
      }
    },
    {
      "id": "polygon_label",
      "source-layer": "ne:states_provinces_shp",
      "type": "symbol",
      "layout": {
        "text-field": "{name}",
        "text-anchor": "center"
        "text-max-width": 14,
        "text-font": ["Arial"]
      },
      "paint": {
        "text-color": "white",
        "text-halo-color": "black",
        "text-halo-width": 1

      }
    }
  ]
}
5.6.2.6. Theming using Multiple Attributes
Answer for Challenge Theming using Multiple Attributes:
A powerful tool is theming using multiple attributes. This is an important concept allowing map readers to perform “integration by eyeball” (detecting correlations between attribute values information).
Challenge: Combine the mapcolor9 and datarank examples to reproduce the following map.
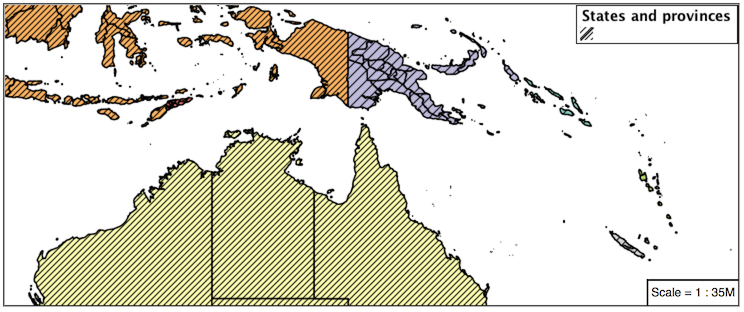
This should be a cut and paste using the
categoricalexample, andintervalexamples already provided.{ "version": 8, "name": "polygon_example", "sprite": "http://localhost:8080/geoserver/styles/sprites", "layers": [ { "id": "polygon", "source-layer": "ne:states_provinces_shp", "type": "fill", "paint": { "fill-color": { "property": "mapcolor9", "type": "categorical", "stops": [ [1, "#8dd3c7"], [2, "#ffffb3"], [3, "#bebada"], [4, "#fb8072"], [5, "#80b1d3"], [6, "#fdb462"], [7, "#b3de69"], [8, "#fccde5"], [9, "#d9d9d9"] ] }, "fill-outline-color": "gray" } }, { "id": "polygon", "source-layer": "ne:states_provinces_shp", "type": "fill", "paint": { "fill-pattern": { "property": "datarank", "type": "interval", "stops": [ [4, "grey_diag8"], [6, "grey_diag16"] ] } } } ] }
5.6.2.7. Use of Z-Index
Answer for Challenge Use of Z-Index:
Using multiple layers to simulate line string casing. The resulting effect is similar to text halos - providing breathing space around complex line work allowing it to stand out.
Challenge: Use what you know of LineString rendering order to reproduce the following map:
This is much easier when using MBStyle, where z-order is controlled by layer.
{
   "version": 8,
   "name": "polygon_example",
   "sprite": "http://localhost:8080/geoserver/styles/sprites",
   "layers": [
     {
       "id": "polygon_fill",
       "source-layer": "ne:states_provinces_shp",
       "type": "fill",
       "paint": {
         "fill-color": "lightgrey",
       }
     },
     {
       "id": "polygon_pattern",
       "source-layer": "ne:states_provinces_shp",
       "type": "fill",
       "paint": {
         "fill-pattern": "grey_diag16"
       }
     }
     {
       "id": "polygon_casing",
       "source-layer": "ne:states_provinces_shp",
       "type": "line",
       "paint": {
         "line-color": "lightgrey",
         "line-width": 6
       }
     },
     {
       "id": "polygon_outline",
       "source-layer": "ne:states_provinces_shp",
       "type": "line",
       "paint": {
         "line-color": "black",
         "line-width": 1.5
       }
     }
   ]
 }
The structure of the legend graphic provides an indication on what is going on.
5.6.2.8. Geometry Location
Answer for Challenge Geometry Location:
The symbol layer can be used to render any geometry content.
Challenge: Try this yourself by rendering polygon data using a symbol layer.
This can be done one of two ways:
Changing the association of a polygon layer, such as
ne:states_provinces_shpto point_example and using the layer preview page.Changing the Layer Preview tab to a polygon layer, such as
ne:states_provinces_shp.
The important thing to notice is that the centroid of each polygon is used as a point location.
Note
A layer in an MBStyle is not the same as a layer in GeoServer. A GeoServer layer is a raster or vector dataset that represents a collection of geographic features. A MBStyle layer is a block of styling information, similar to a SLD Symbolizer.
5.6.2.9. Dynamic Symbolization
Answer for Explore Dynamic Symbolization:
icon-imageprovides an opportunity for dynamic symbolization.This is accomplished by using a function for the value of
icon-image:{ "version": 8, "name": "point_example", "sprite": "http://localhost:8080/geoserver/styles/sprites", "layers": [ { "id": "point_capital", "type": "symbol", "source-layer": "ne:populated_places", "layout": { "icon-image": { "type": "categorical", "property": "FEATURECLA", "default": "grey_circle", "stops": [ ["Admin-0 capital", "star"] ] } } } ] }
Challenge: Use this approach to rewrite the Dynamic Styling example.
Example available here
point_example.json:
5.6.2.10. Raster Opacity
Discussion for Challenge Raster Opacity:
There is a quick way to make raster data transparent, raster opacity property works in the same fashion as with vector data. The raster as a whole will be drawn partially transparent allow content from other layers to provide context.
Challenge: Can you think of an example where this would be useful?
This is difficult as raster data is usually provided for use as a basemap, with layers being drawn over top.
The most obvious example here is the display of weather systems, or model output such as fire danger. By drawing the raster with some transparency, the landmass can be shown for context.