Coverage Views
Starting with GeoServer 2.6.0, You can define a new raster layer as a Coverage View. Coverage Views allow defining a View made of different bands originally available inside coverages (either bands of the same coverage or different coverages) of the same Coverage Store.
Creating a Coverage View
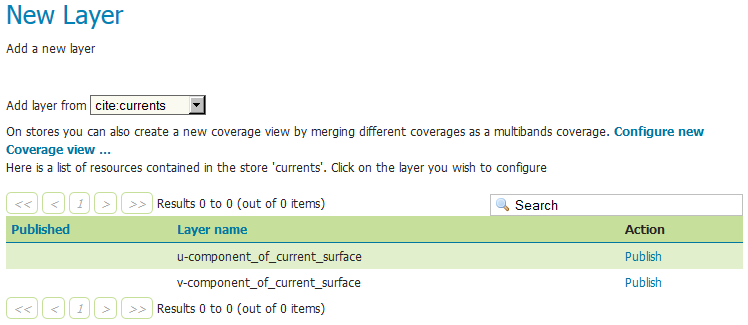
In order to create a Coverage View the administrator invokes the Create new layer page. When a Coverage store is selected, the usual list of coverages available for publication appears. A link Configure new Coverage view… also appears:
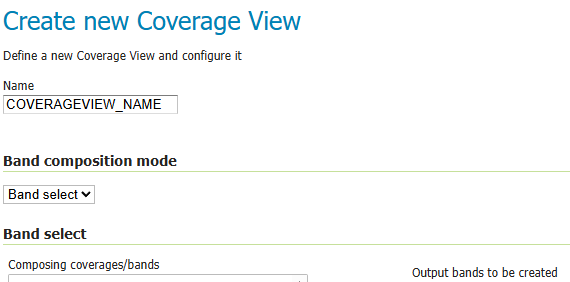
Selecting the Configure new Coverage view… link opens a new page where you can configure the coverage view.
Band select mode
By default, the CoverageView are composed in Band select mode.
Allowing the user to select certain coverages/bands from the provided list to be part of the output.
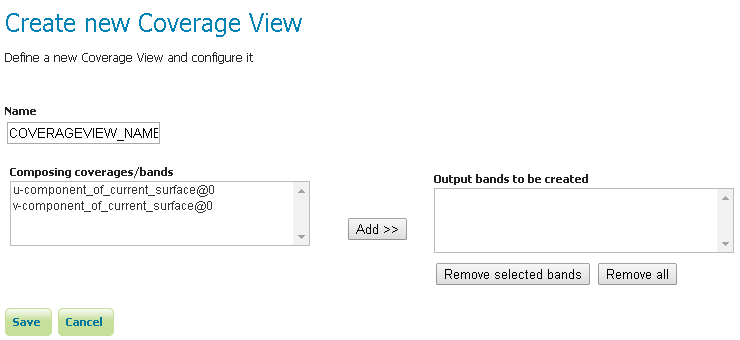
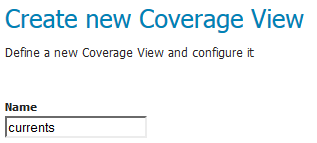
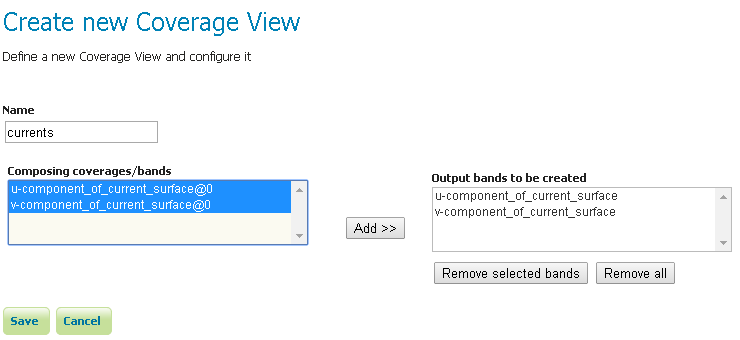
The upper text box allows to specify the name to be assigned to this coverage view. (In the following picture we want to create as example, a currents view merging together both u and v components of the currents, which are exposed as separated 1band coverages).
Next step is defining the output bands to be put in the coverage view. It is possible to specify which input coverage bands need to be put on the view by selecting them from the Composing coverages/bands….
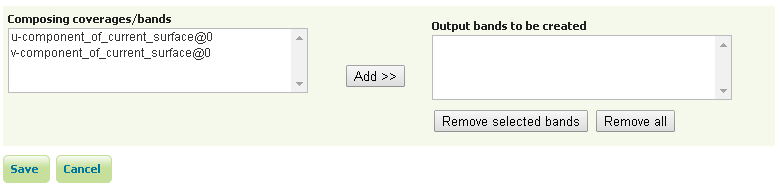
Once selected, they needs to be added to the output bands of the coverage view, using the add button.
Optionally, is it possible to remove the newly added bands using the remove and remove all buttons. Once done, clicking on the save button will redirect to the standard Layer configuration page.
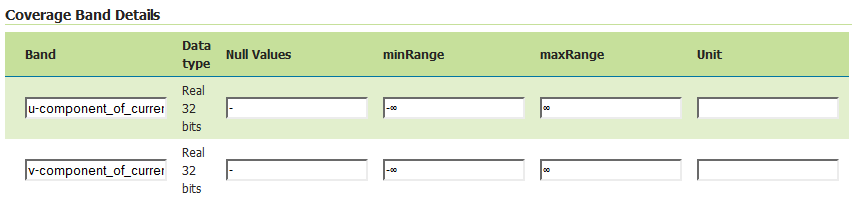
Scrolling down to the end of the page, is it possible to see the bands composing the coverage (and verify they are the one previously selected).
At any moment, the Coverage View can be refined and updated by selecting the Edit Coverage view… link available before the Coverage Bands details section.

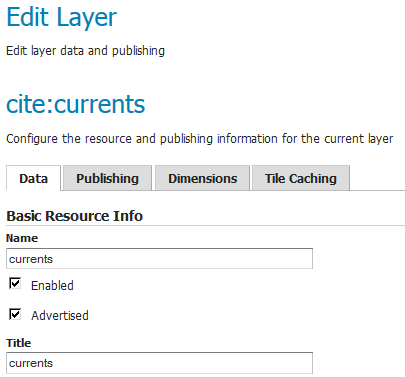
Once all the properties of the layer have been configured, by selecting the Save button, the coverage will be saved in the catalog and it will become visible as a new layer.

Jiffle expressions to create coverage views
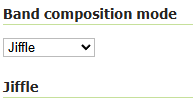
A dropdown selector allows users to choose an alternative band composition mode: Jiffle.
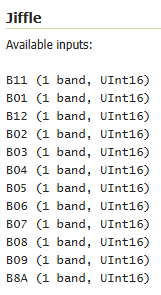
This mode enables support for Jiffle expressions in the coverage view setup. When this mode is selected, a summary of all available coverages and bands is displayed.
For instance, an ImageMosaic based on Sentinel-2 coverages would produce a summary similar to the example below:
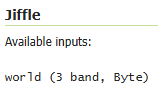
Whilst a simple True Marble Image stored on a world.tif file, with 3 RGB bands will be reported like this:
Defining the Jiffle Expression
The Output Name text area allows to define the output variable to be produced.
The Jiffle Script text area allows to define a Jiffle expression to produce that output.
For example, using the Sentinel-2 dataset, an NDVI single output band can be defined by combining the B04 and B08 bands using the following formula
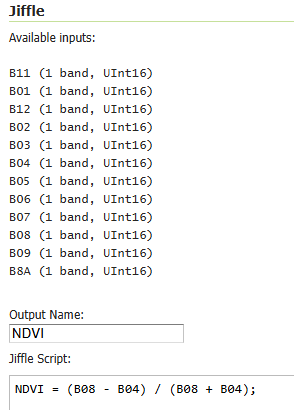
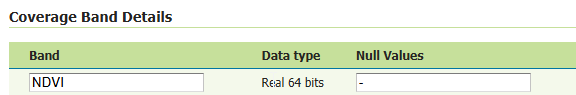
Upon saving, the output band will be reported in the coverage band details:
If the output needs to consist of multiple bands, an index-based syntax should be used, as shown below:
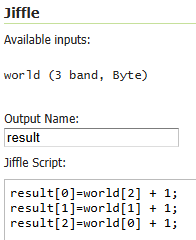
Where the same output name is used for all the bands (i.e. result) and bands are specified by index.
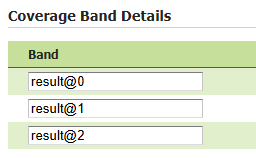
In that case, the band details of the coverage view will look like this:
Finally, a dropdown selector allows selection of one of the inputs to serve as a reference for the internal logic - for example, when retrieving available time values in a time series context.

This selection is necessary because some input bands used in the view (for example auxiliary bands as quality flags or masks) may have missing granules or lack data, so a clear reference input must be explicitly specified.
The selected input must be one that is used in the Jiffle expression. If it isn’t, an error will be raised when attempting to save the view.
There is an option that allows GeoServer to handle missing input coverages more gracefully when composing multi-band views.

By default, this option is disabled. In that case, if any of the input coverages are missing (null) for a given request, the entire CoverageView will return empty because some required inputs are missing.
When enabled, GeoServer will generate a synthetic coverage band filled with the appropriate NoData value for each missing input, allowing the view to remain complete and defined.
The NoData value is derived from the coverage itself—either defined directly in the data or, in the case of an ImageMosaic, eventually specified in the associated .properties file.
This behavior applies only when at least one input coverage is available. If all inputs are missing, the request is assumed to either lie outside the view’s data extent or lack all required inputs, and no synthetic coverage will be generated.
Heterogeneous coverage views
In case the various coverages bound in the view have different resolution, the UI will present two extra controls:
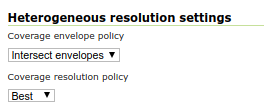
The coverage envelope policy defines how the bounding box of the output is calculated for metadata purposes. Having different resolutions, the coverages are unlikely to share the same bounding box. The possible values are:
Intersect envelopes: Use the intersection of all input coverage envelopes
Union envelopes: Use the union of all input coverage envelopes
The coverage resolution policy defines which target resolution is used when generating outputs:
Best: Use the best resolution available among the chosen bands (e.g., in a set having 60m, 20m and 10m the 10m resolution will be chosen)
Worst: Use the worst resolution available among the chosen bands (e.g., in a set having 60m, 20m and 10m the 60m resolution will be chosen)
The coverage resolution policy is context sensitive. Assume the input is a 12 bands Sentinel 2 dataset at three different resolution, 10, 20 and 30 meters, and a false color image is generated by performing a band selection in the SLD. If the policy is best and the SLD selects only bands at 20 and 60 meters, the output will be at 20 meters instead of 10 meters.
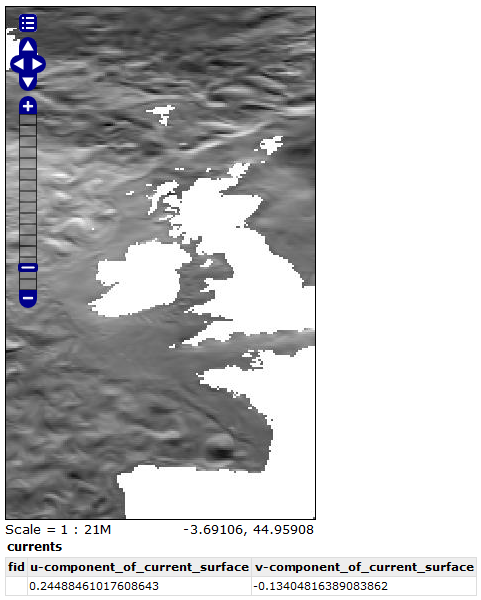
Coverage View in action
A Layer preview of the newly created coverage view will show the rendering of the view. Note that clicking on a point on the map will result into a GetFeatureInfo call which will report the values of the bands composing the coverage view.