Troubleshooting
User Interface
The Web administration interface is used to configure the GeoServer application, and is often where an issue is first observed.
Oops, something went wrong
An unexpected problem that is encountered when using the web administration console is reported as an org.apache.wicket.WicketRuntimeException, with additional information shown in the form of a Java Stack Trace.
Failures in GeoServer often show up as Java stack traces. It is important to read the entire stack trace all the way through to the end to determine the initial cause.
Example: File System Permission
Here is an example where GeoServer application did not have write permission in the GEOSERVER_DATA_DIR location:
org.apache.wicket.WicketRuntimeException: Error attaching this container for rendering
    ...
Caused by: java.lang.IllegalStateException: Cannot create security/masterpw.digest
    ...
Caused by: java.io.IOException: Access is denied
    at java.io.WinNTFileSystem.createFileExclusively(Native Method)
    at java.io.File.createNewFile(Unknown Source)
Reading the entire stack trace from the bottom to the top:
It was unable to access a directory due to file permission.
This occurred when attempting to create
security/masterpw.digestWicketRuntimeException indicates this failure was observed in the user interface.
This was so unexpected or unusual the user interface displays an “Oops something went wrong” page and was unable to continue.
Assessment: For this specific example the error occurred when setting up the security folder. This is something GeoServer does when starting the first time. Without a default security configuration user interface was unable to function.
User interface non-responsive
Check the browser “Developer Tools” console for Content Security Policy errors:
Refused to send form data to 'https://gs-main.geosolutionsgroup.com/geoserver/j_spring_security_check' because it violates the following Content Security Policy directive: "form-action 'self'".
Content-Security-Policy: The page’s settings blocked a style (style-src-elem) at http://localhost:8080/geoserver/web/wicket/resource/org.geoserver.web.GeoServerBasePage/css/blueprint/screen-ver-5E7BA86A4C3BEA6B457AC3C7F9ADF9B4.css from being applied because it violates the following directive: “style-src 'nonce-_BrhuCNPcn8dWJbyQ1IqkS3R'” 3 NetUtil.sys.mjs:144:15
The use of Content Security Policy headers is an additional safety precaution introduced by your browser to mitigate cross-site scripting and clickjacking attacks:
It is expected that the web administration console functions correctly, along with extensions and community modules.
If you encounter any CSP problems please let us know, as an open-source project we depend on public feedback and testing to report these issues.
If you have recently upgraded GeoServer you may also try refreshing the page Control-R, or reloading the page ignoring the cache content Control-Shift-R.
With these improved CSP safety measures GeoServer may now detect vulnerabilities in your environment that were previously undetected.
The
form-action 'self'error above is an example, caused by a proxy forwarding a request to GeoServer using http: which did not match the https: defined by the GeoServer Proxy Base URL setting.GeoServer provides tools for administrators to control content security policy headers, see GeoServer Security section on Content Security Policy for very detailed information.
These facilities can be used to mitigate CSP problems that have been reported with administration console, extensions or a community modules.
To restore access to the user interface when troubleshooting you may choose to disable CSP enforcement with the environmental variable org.geoserver.web.csp.strict:
true: Content Security Policy violations will be blocked by the browser use of headerContent-Security-Policy.false: Content Security Policy violations will be reported in the developer tools console only with headerContent-Security-Policy-Report-Only.
This setting is intended to report CSP violations to the browser JavaScript console, so you can review and troubleshoot.
Web Services
Checking WFS requests
It often happens that users report issues with hand-crafted WFS requests not working as expected. In the majority of the cases the request is malformed, but GeoServer does not complain and just ignores the malformed part (this behaviour is the default to make older WFS clients work fine with GeoServer).
If you want GeoServer to validate most WFS XML request you can post it to the following URL:
http://host:port/geoserver/ows?strict=true
Any deviation from the required structure will be noted in an error message. The only request type that is not validated in any case is the INSERT one (this is a GeoServer own limitation).
Leveraging GeoServer own log
GeoServer can generate a quite extensive log of its operations in the $GEOSERVER_DATA_DIR/logs/geoserver.log file.
Looking into such file is one of the first things to do when troubleshooting a problem, in particular it’s interesting to see the log contents in correspondence of a misbehaving request.
The amount of information logged can vary based on the logging profile chosen in the Server Settings configuration page. Review Advanced log configuration for additional guidance on creating your own Custom logging profiles to troubleshoot a specific problem.
Logging service requests
GeoServer provides a request logging capability that is inactive by default. When enabled in the global settings GeoServer can log both the requested URL and POST requests contents.
Global Settings
To track the history of the incoming requests:
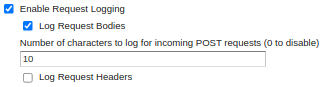
Enable request logging by navigating to page, scroll down to Logging Settings, and Enable Request Logging.
Enable this feature using Enable Request Logging.
Optionally select Log Request Bodies to troubleshoot POST or PUT requests (for example WFS Transaction). The Number of characters to log setting will put an upper limit on the amount of data that is logged in order to avoid logging related performance issues.
Optionally select Log Request Headers to troubleshoot Request Headers (for example when checking security credentials).
Click Apply to apply these settings.
This will log request information, resulting in something like the following:
08 gen 11:30:13 INFO [geoserver.filters] - 127.0.0.1 "GET /geoserver/wms?HEIGHT=330&WIDTH=660&LAYERS=nurc%3AArc_Sample&STYLES=&SRS=EPSG%3A4326&FORMAT=image%2Fjpeg&SERVICE=WMS&VERSION=1.1.1&REQUEST=GetMap&EXCEPTIONS=application%2Fvnd.ogc.se_inimage&BBOX=-93.515625,-40.078125,138.515625,75.9375" "Mozilla/5.0 (X11; U; Linux i686; it; rv:1.9.0.15) Gecko/2009102815 Ubuntu/9.04 (jaunty) Firefox/3.0.15" "http://localhost:8080/geoserver/wms?service=WMS&version=1.1.0&request=GetMap&layers=nurc:Arc_Sample&styles=&bbox=-180.0,-90.0,180.0,90.0&width=660&height=330&srs=EPSG:4326&format=application/openlayers"
08 gen 11:30:13 INFO [geoserver.filters] - 127.0.0.1 "GET /geoserver/wms?HEIGHT=330&WIDTH=660&LAYERS=nurc%3AArc_Sample&STYLES=&SRS=EPSG%3A4326&FORMAT=image%2Fjpeg&SERVICE=WMS&VERSION=1.1.1&REQUEST=GetMap&EXCEPTIONS=application%2Fvnd.ogc.se_inimage&BBOX=-93.515625,-40.078125,138.515625,75.9375" took 467ms
08 gen 11:30:14 INFO [geoserver.filters] - 127.0.0.1 "GET /geoserver/wms?REQUEST=GetFeatureInfo&EXCEPTIONS=application%2Fvnd.ogc.se_xml&BBOX=-93.515625%2C-40.078125%2C138.515625%2C75.9375&X=481&Y=222&INFO_FORMAT=text%2Fhtml&QUERY_LAYERS=nurc%3AArc_Sample&FEATURE_COUNT=50&Layers=nurc%3AArc_Sample&Styles=&Srs=EPSG%3A4326&WIDTH=660&HEIGHT=330&format=image%2Fjpeg" "Mozilla/5.0 (X11; U; Linux i686; it; rv:1.9.0.15) Gecko/2009102815 Ubuntu/9.04 (jaunty) Firefox/3.0.15" "http://localhost:8080/geoserver/wms?service=WMS&version=1.1.0&request=GetMap&layers=nurc:Arc_Sample&styles=&bbox=-180.0,-90.0,180.0,90.0&width=660&height=330&srs=EPSG:4326&format=application/openlayers"
08 gen 11:30:14 INFO [geoserver.filters] - 127.0.0.1 "GET /geoserver/wms?REQUEST=GetFeatureInfo&EXCEPTIONS=application%2Fvnd.ogc.se_xml&BBOX=-93.515625%2C-40.078125%2C138.515625%2C75.9375&X=481&Y=222&INFO_FORMAT=text%2Fhtml&QUERY_LAYERS=nurc%3AArc_Sample&FEATURE_COUNT=50&Layers=nurc%3AArc_Sample&Styles=&Srs=EPSG%3A4326&WIDTH=660&HEIGHT=330&format=image%2Fjpeg" took 314ms
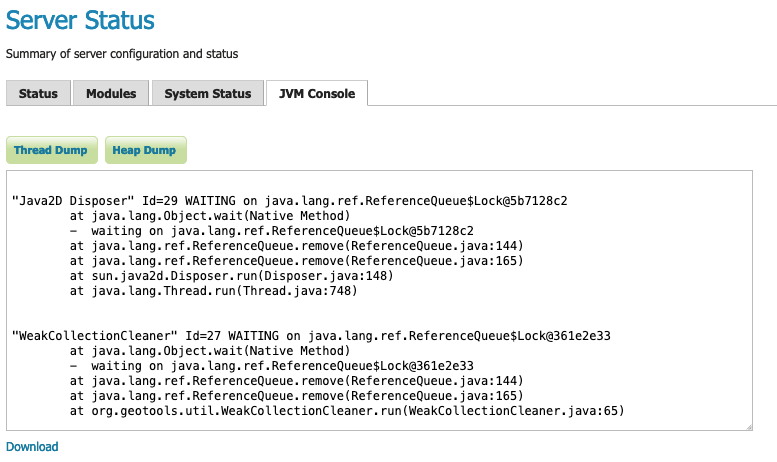
Server Status JVM Console
GeoServer provides a built-in JVM Console used to obtain:
Thread Dump information
Heap Dump information
This page can be used to check current status and download the results for careful review.
JVM Console
Using JDK tools to get stack and memory dumps
The JDK contains three useful command line tools that can be used to gather information about GeoServer instances that are leaking memory or not performing as requested: jps, jstack and jmap.
All tools work against a live Java Virtual Machine, the one running GeoServer in particular. In order for them to work properly you’ll have to run them with a user that has enough privileges to connect to the JVM process, in particular super user or the same user that’s running the JVM usually have the required right.
jps
jps is a tool listing all the Java processing running. It can be used to retrieve the pid (process id) of the virtual machine that is running GeoServer. For example:
> jps -mlv

16235 org.apache.catalina.startup.Bootstrap start -Djava.util.logging.manager=org.apache.juli.ClassLoaderLogManager -Djava.util.logging.config.file=/home/aaime/devel/webcontainers/apache-tomcat-6.0.18/conf/logging.properties -Djava.endorsed.dirs=/home/aaime/devel/webcontainers/apache-tomcat-6.0.18/endorsed -Dcatalina.base=/home/aaime/devel/webcontainers/apache-tomcat-6.0.18 -Dcatalina.home=/home/aaime/devel/webcontainers/apache-tomcat-6.0.18 -Djava.io.tmpdir=/home/aaime/devel/webcontainers/apache-tomcat-6.0.18/temp
11521  -XX:MinHeapFreeRatio=10 -XX:MaxHeapFreeRatio=20 -Djava.library.path=/usr/lib/jni -Dosgi.requiredJavaVersion=1.5 -XX:MaxPermSize=256m -Xms64m -Xmx1024m -XX:CMSClassUnloadingEnabled -XX:CMSPermGenSweepingEnabled -XX:+UseParNewGC
16287 sun.tools.jps.Jps -mlv -Dapplication.home=/usr/lib/jvm/java-6-sun-1.6.0.16 -Xms8m
The output shows the pid, the main class name if available, and the parameters passed to the JVM at startup. In this example 16235 is Tomcat hosting GeoServer, 11521 is an Eclipse instance, and 16287 is jps itself. In the common case you’ll have only few JVM and the one running GeoServer can be identified by the parameters passed to it.
jstack
jstack is a tool for extracting the current stack trace for each thread running in the virtual machine. It can be used to identify scalability issues and to gather what the program is actually doing.
It usually requires detailed understanding of the inner workings of GeoServer to properly interpret the jstack output.
An example of usage:
> jstack -F -l 16235 > /tmp/tomcat-stack.txt
Attaching to process ID 16235, please wait...
Debugger attached successfully.
Server compiler detected.
JVM version is 14.2-b01
And the file contents might look like:
Deadlock Detection:

No deadlocks found.

Thread 16269: (state = BLOCKED)
 - java.lang.Object.wait(long) @bci=0 (Interpreted frame)
 - org.apache.tomcat.util.threads.ThreadPool$MonitorRunnable.run() @bci=10, line=565 (Interpreted frame)
 - java.lang.Thread.run() @bci=11, line=619 (Interpreted frame)

Locked ownable synchronizers:
    - None

Thread 16268: (state = IN_NATIVE)
 - java.net.PlainSocketImpl.socketAccept(java.net.SocketImpl) @bci=0 (Interpreted frame)
 - java.net.PlainSocketImpl.accept(java.net.SocketImpl) @bci=7, line=390 (Interpreted frame)
 - java.net.ServerSocket.implAccept(java.net.Socket) @bci=60, line=453 (Interpreted frame)
 - java.net.ServerSocket.accept() @bci=48, line=421 (Interpreted frame)
 - org.apache.jk.common.ChannelSocket.accept(org.apache.jk.core.MsgContext) @bci=46, line=306 (Interpreted frame)
 - org.apache.jk.common.ChannelSocket.acceptConnections() @bci=72, line=660 (Interpreted frame)
 - org.apache.jk.common.ChannelSocket$SocketAcceptor.runIt(java.lang.Object[]) @bci=4, line=870 (Interpreted frame)
 - org.apache.tomcat.util.threads.ThreadPool$ControlRunnable.run() @bci=167, line=690 (Interpreted frame)
 - java.lang.Thread.run() @bci=11, line=619 (Interpreted frame)

Locked ownable synchronizers:
    - None

Thread 16267: (state = BLOCKED)
 - java.lang.Object.wait(long) @bci=0 (Interpreted frame)
 - java.lang.Object.wait() @bci=2, line=485 (Interpreted frame)
 - org.apache.tomcat.util.threads.ThreadPool$ControlRunnable.run() @bci=26, line=662 (Interpreted frame)
 - java.lang.Thread.run() @bci=11, line=619 (Interpreted frame)

Locked ownable synchronizers:
    - None

...
jmap
jmap is a tool to gather information about the Java virtual machine. It can be used in a few interesting ways.
By running it without arguments (other than the process id of the JVM) it will print out a dump of the native libraries used by the JVM. This can come in handy when one wants to double check GeoServer is actually using a certain version of a native library (e.g., GDAL):
> jmap 17251

Attaching to process ID 17251, please wait...
Debugger attached successfully.
Server compiler detected.
JVM version is 14.2-b01
0x08048000  46K   /usr/lib/jvm/java-6-sun-1.6.0.16/jre/bin/java
0x7f87f000  6406K /usr/lib/jvm/java-6-sun-1.6.0.16/jre/lib/i386/libNCSEcw.so.0
0x7f9b2000  928K  /usr/lib/libstdc++.so.6.0.10
0x7faa1000  7275K /usr/lib/jvm/java-6-sun-1.6.0.16/jre/lib/i386/libgdal.so.1
0x800e9000  1208K /usr/lib/jvm/java-6-sun-1.6.0.16/jre/lib/i386/libclib_jiio.so
0x80320000  712K  /usr/lib/jvm/java-6-sun-1.6.0.16/jre/lib/i386/libNCSUtil.so.0
0x80343000  500K  /usr/lib/jvm/java-6-sun-1.6.0.16/jre/lib/i386/libNCSCnet.so.0
0x8035a000  53K   /lib/libgcc_s.so.1
0x8036c000  36K   /usr/lib/jvm/java-6-sun-1.6.0.16/jre/lib/i386/libnio.so
0x803e2000  608K  /usr/lib/jvm/java-6-sun-1.6.0.16/jre/lib/i386/libawt.so
0x80801000  101K  /usr/lib/jvm/java-6-sun-1.6.0.16/jre/lib/i386/libgdaljni.so
0x80830000  26K   /usr/lib/jvm/java-6-sun-1.6.0.16/jre/lib/i386/headless/libmawt.so
0x81229000  93K   /usr/lib/jvm/java-6-sun-1.6.0.16/jre/lib/i386/libnet.so
0xb7179000  74K   /usr/lib/jvm/java-6-sun-1.6.0.16/jre/lib/i386/libzip.so
0xb718a000  41K   /lib/tls/i686/cmov/libnss_files-2.9.so
0xb7196000  37K   /lib/tls/i686/cmov/libnss_nis-2.9.so
0xb71b3000  85K   /lib/tls/i686/cmov/libnsl-2.9.so
0xb71ce000  29K   /lib/tls/i686/cmov/libnss_compat-2.9.so
0xb71d7000  37K   /usr/lib/jvm/java-6-sun-1.6.0.16/jre/lib/i386/native_threads/libhpi.so
0xb71de000  184K  /usr/lib/jvm/java-6-sun-1.6.0.16/jre/lib/i386/libjava.so
0xb7203000  29K   /lib/tls/i686/cmov/librt-2.9.so
0xb725d000  145K  /lib/tls/i686/cmov/libm-2.9.so
0xb7283000  8965K /usr/lib/jvm/java-6-sun-1.6.0.16/jre/lib/i386/server/libjvm.so
0xb7dc1000  1408K /lib/tls/i686/cmov/libc-2.9.so
0xb7f24000  9K    /lib/tls/i686/cmov/libdl-2.9.so
0xb7f28000  37K   /usr/lib/jvm/java-6-sun-1.6.0.16/jre/lib/i386/jli/libjli.so
0xb7f32000  113K  /lib/tls/i686/cmov/libpthread-2.9.so
0xb7f51000  55K   /usr/lib/jvm/java-6-sun-1.6.0.16/jre/lib/i386/libverify.so
0xb7f60000  114K  /lib/ld-2.9.so
It’s also possible to get a quick summary of the JVM heap status:
> jmap -heap 17251

Attaching to process ID 17251, please wait...
Debugger attached successfully.
Server compiler detected.
JVM version is 14.2-b01

using thread-local object allocation.
Parallel GC with 2 thread(s)

Heap Configuration:
   MinHeapFreeRatio = 40
   MaxHeapFreeRatio = 70
   MaxHeapSize      = 778043392 (742.0MB)
   NewSize          = 1048576 (1.0MB)
   MaxNewSize       = 4294901760 (4095.9375MB)
   OldSize          = 4194304 (4.0MB)
   NewRatio         = 8
   SurvivorRatio    = 8
   PermSize         = 16777216 (16.0MB)
   MaxPermSize      = 67108864 (64.0MB)

Heap Usage:
PS Young Generation
Eden Space:
   capacity = 42401792 (40.4375MB)
   used     = 14401328 (13.734176635742188MB)
   free     = 28000464 (26.703323364257812MB)
   33.96396076845054% used
From Space:
   capacity = 4718592 (4.5MB)
   used     = 2340640 (2.232208251953125MB)
   free     = 2377952 (2.267791748046875MB)
   49.60462782118056% used
To Space:
   capacity = 4587520 (4.375MB)
   used     = 0 (0.0MB)
   free     = 4587520 (4.375MB)
   0.0% used
PS Old Generation
   capacity = 43188224 (41.1875MB)
   used     = 27294848 (26.0303955078125MB)
   free     = 15893376 (15.1571044921875MB)
   63.19974630121396% used
PS Perm Generation
   capacity = 38404096 (36.625MB)
   used     = 38378640 (36.60072326660156MB)
   free     = 25456 (0.0242767333984375MB)
   99.93371540369027% used
In the result it can be seen that the JVM is allowed to use up to 742MB of memory, and that at the moment the JVM is using 130MB (rough sum of the capacities of each heap section). In case of a persistent memory leak the JVM will end up using whatever is allowed to and each section of the heap will be almost 100% used.
To see how the memory is actually being used in a succinct way the following command can be used (on Windows, replace head -25 with more):
> jmap -histo:live 17251 | head -25

 num     #instances         #bytes  class name
----------------------------------------------
   1:         81668       10083280  <constMethodKlass>
   2:         81668        6539632  <methodKlass>
   3:         79795        5904728  [C
   4:        123511        5272448  <symbolKlass>
   5:          7974        4538688  <constantPoolKlass>
   6:         98726        3949040  org.hsqldb.DiskNode
   7:          7974        3612808  <instanceKlassKlass>
   8:          9676        2517160  [B
   9:          6235        2465488  <constantPoolCacheKlass>
  10:         10054        2303368  [I
  11:         83121        1994904  java.lang.String
  12:         27794        1754360  [Ljava.lang.Object;
  13:          9227         868000  [Ljava.util.HashMap$Entry;
  14:          8492         815232  java.lang.Class
  15:         10645         710208  [S
  16:         14420         576800  org.hsqldb.CachedRow
  17:          1927         574480  <methodDataKlass>
  18:          8937         571968  org.apache.xerces.dom.ElementNSImpl
  19:         12898         561776  [[I
  20:         23122         554928  java.util.HashMap$Entry
  21:         16910         541120  org.apache.xerces.dom.TextImpl
  22:          9898         395920  org.apache.xerces.dom.AttrNSImpl
By the dump we can see most of the memory is used by the GeoServer code itself (first 5 items) followed by the HSQL cache holding a few rows of the EPSG database. In case of a memory leak a few object types will hold the vast majority of the live heap. Mind, to look for a leak the dump should be gathered with the server almost idle. If, for example, the server is under a load of GetMap requests the main memory usage will be the byte[] holding the images while they are rendered, but that is not a leak, it’s legitimate and temporary usage.
In case of memory leaks a developer will probably ask for a full heap dump to analyze with a high end profiling tool. Such a dump can be generated with the following command:
> jmap -dump:live,file=/tmp/dump.hprof 17251
Dumping heap to /tmp/dump.hprof ...
Heap dump file created
The dump files are generally as big as the memory used so it’s advisable to compress the resulting file before sending it to a developer.
Configuration
XStream
GeoServer and GeoWebCache use XStream to read and write XML for configuration and for their REST APIs. In order to do this securely, it needs a list of Java classes that are safe to convert between objects and XML. If a class not on that list is given to XStream, it will generate the error com.thoughtworks.xstream.security.ForbiddenClassException. The specific class that was a problem should also be included. This may be a result of the lists of allowed classes missing a class, which should be reported as a bug, or it may be caused by an extension/plugin not adding its classes to the list (finally, it could be someone trying to perform a “Remote Execution” attack, which is what the allow-list is designed to prevent).
This can be worked around by setting the system properties GEOSERVER_XSTREAM_WHITELIST for GeoServer or GEOWEBCACHE_XSTREAM_WHITELIST for GeoWebCache to a semicolon separated list of qualified class names. The class names may include wildcards ? for a single character, * for any number of characters not including the separator ., and ** for any number of characters including separators. For instance, org.example.blah.SomeClass; com.demonstration.*; ca.test.** will allow the specific class org.example.blah.SomeClass, any class immediately within the package com.demonstration, and any class within the package ca.test or any of its descendant packages.
GEOSERVER_XSTREAM_WHITELIST and GEOWEBCACHE_XSTREAM_WHITELIST should only be used as a workaround until GeoServer, GWC, or the extension causing the problem has been updated, so please report to the users list the missing classes as soon as possible.